My_Vessel: Bathymetry Route Planner & Energy Simulation
Interactive vessel routing, bathymetry-aware planning, and voyage energy analysis in Streamlit
Overview
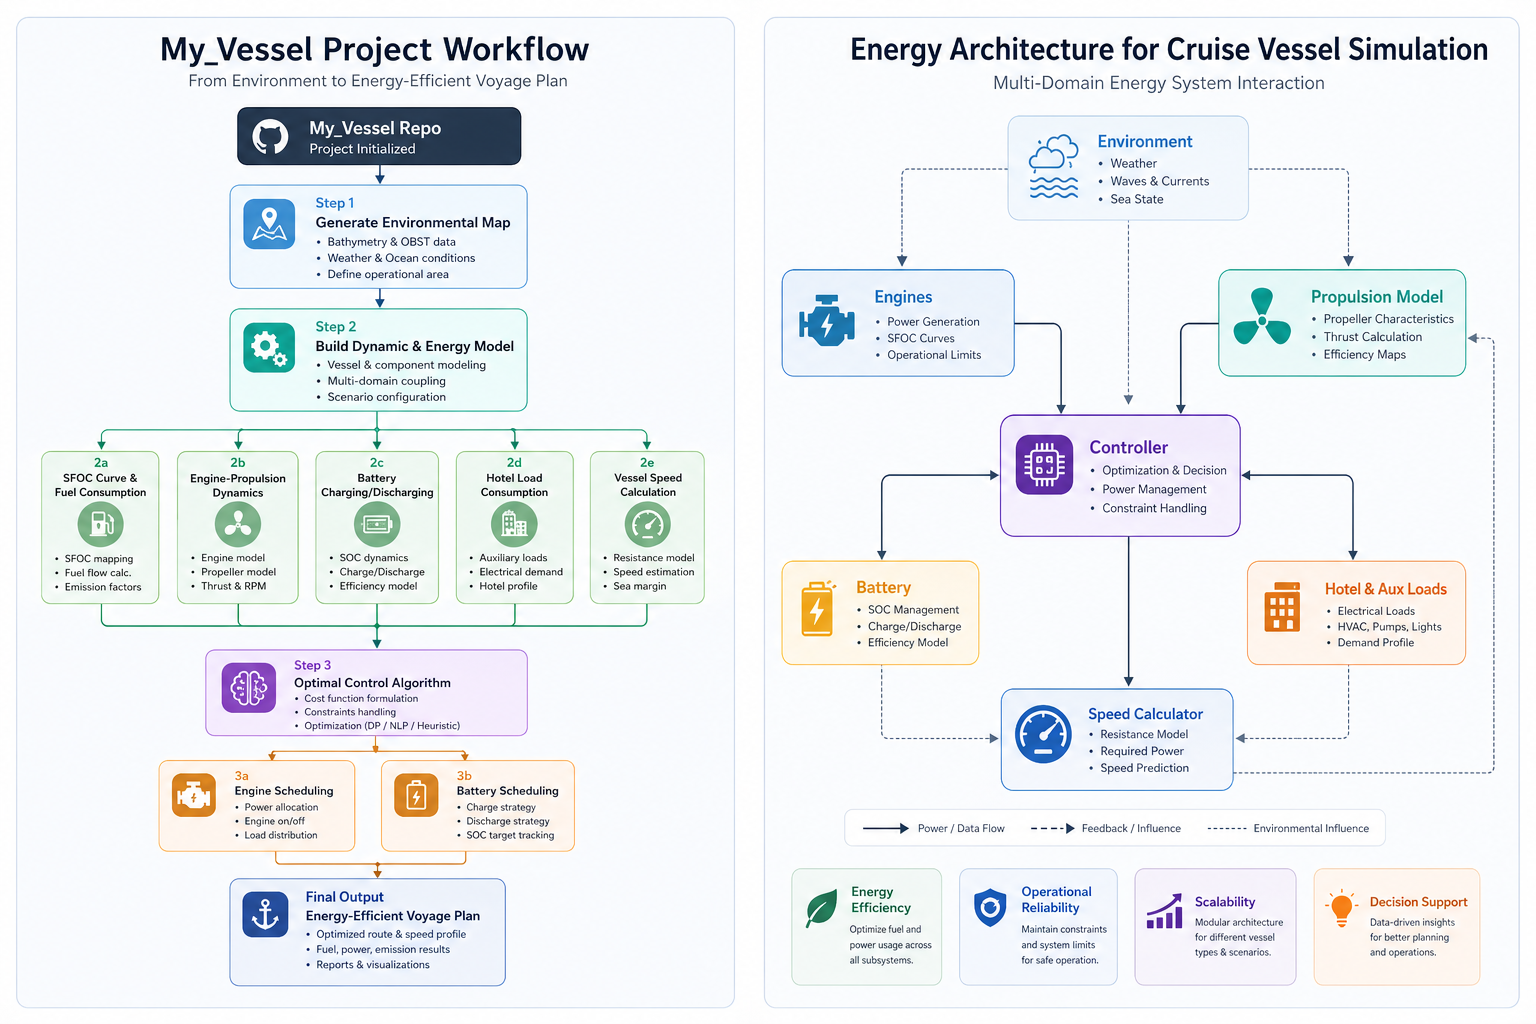
This project is a modular Python framework for simulating vessel routing and energy performance. It combines bathymetry-based route planning, environmental data, engine modeling, and fuel-consumption analysis in an interactive Streamlit application. The user can define a sailing region, select start and goal points, configure vessel parameters, and generate a feasible route with performance plots.
Problem Statement
Marine route planning must consider more than geographic distance. A practical vessel route should account for water depth, under-keel clearance, vessel draft, environmental conditions, speed profile, engine behavior, and fuel usage. The challenge is to combine route planning and energy simulation into one workflow that can be used for research and decision support.
Solution Approach
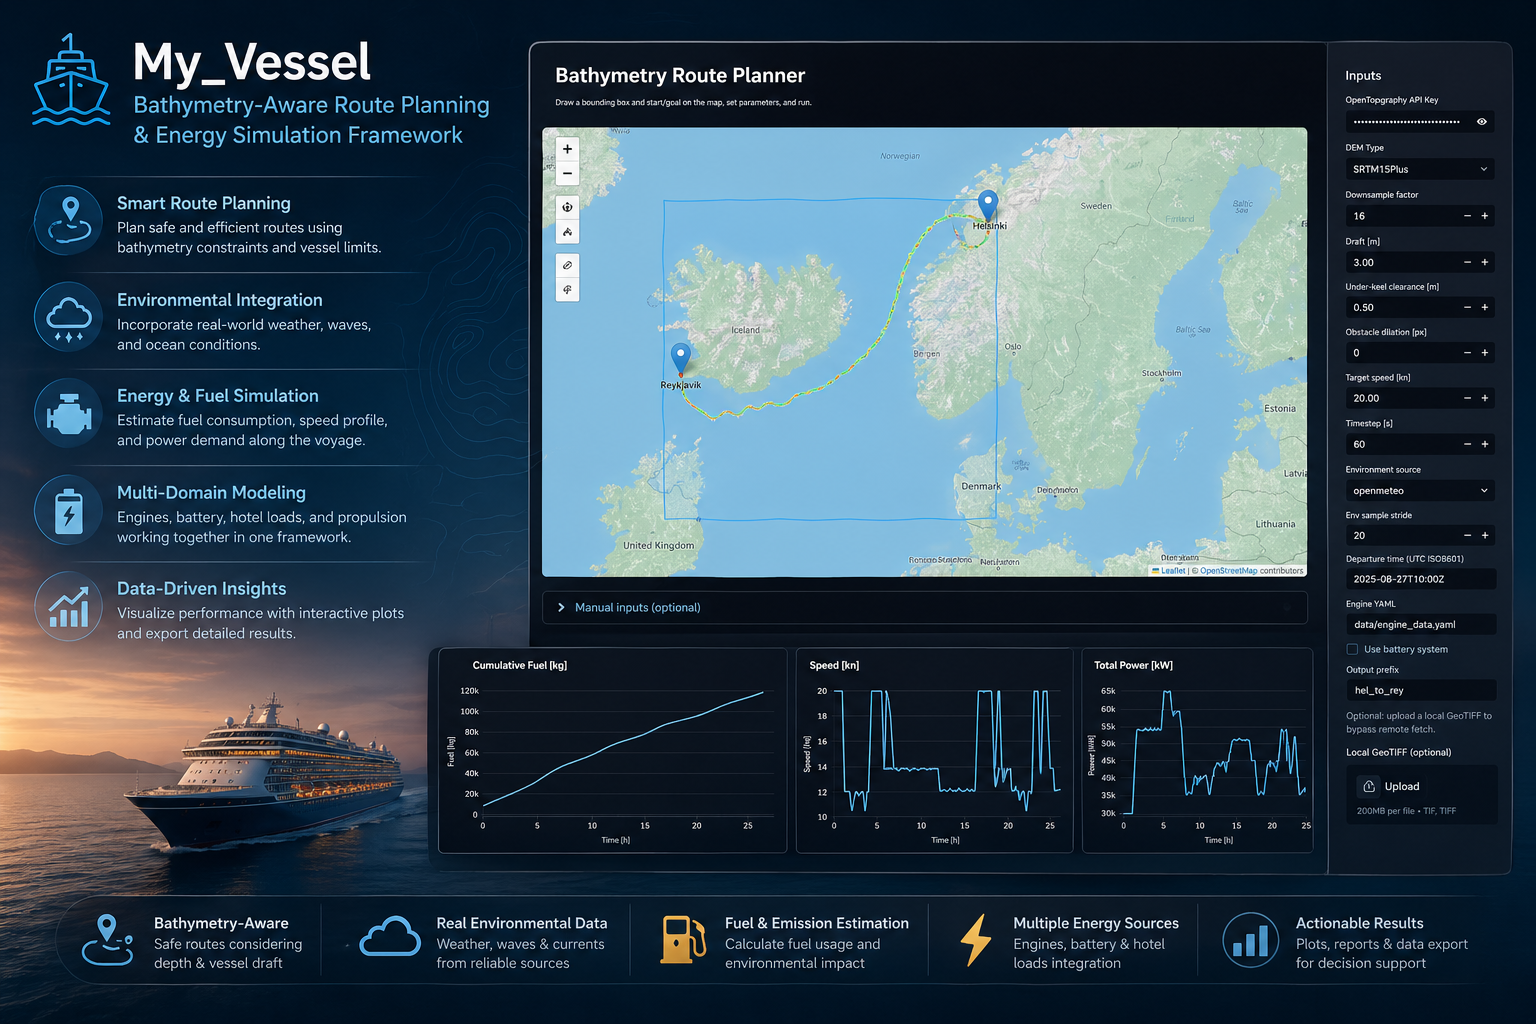
- Built an interactive Streamlit app for route setup and visualization
- Integrated map-based bounding-box and start/goal selection
- Used bathymetry data to identify navigable and non-navigable regions
- Implemented route planning over a depth-constrained grid
- Added vessel draft and under-keel-clearance constraints
- Integrated environmental data options such as Open-Meteo
- Added engine and fuel-consumption modeling through YAML engine data
- Generated route maps, cumulative fuel plots, speed profiles, and total power plots
Interactive Workflow
The Streamlit interface allows the user to draw a bounding box, place start and goal markers on the map, set draft and speed parameters, and run the route planner from a single workspace.
Key Features
- Interactive map-based route planning
- Bathymetry-aware obstacle detection
- Start/goal marker selection
- Adjustable vessel draft and under-keel clearance
- Target speed and timestep configuration
- Environmental data integration
- Engine YAML configuration
- Fuel, speed, and power visualization
- Optional local GeoTIFF upload
- Research-ready CSV, GeoJSON, PNG, and HTML outputs
Results & Validation
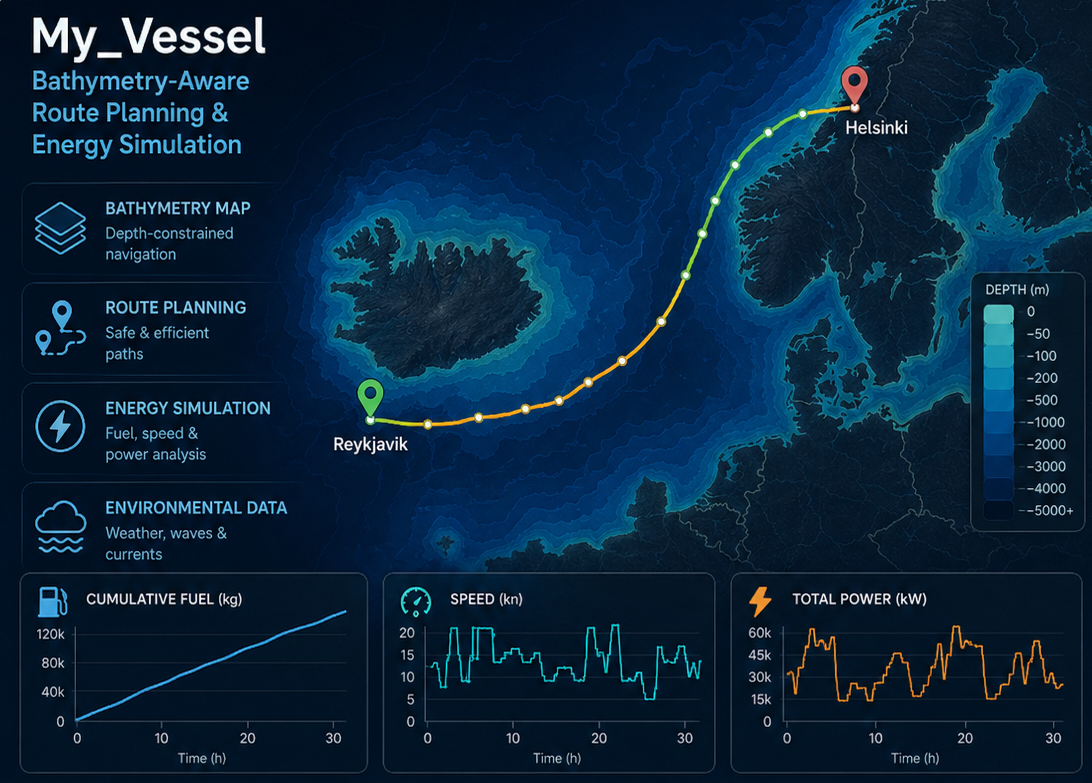
- Demonstrated route planning between Helsinki and Reykjavik
- Generated bathymetry-constrained route visualization
- Produced cumulative fuel-consumption analysis
- Produced speed and total-power profiles over the voyage
- Built a workflow suitable for testing vessel energy and routing strategies
The results view combines route geometry with time-series outputs, making it possible to inspect both navigational feasibility and voyage energy behavior in the same analysis pass.
Technical Implementation
The framework is written in Python and includes a Streamlit front end, bathymetry data processing, grid generation, route planning, environmental sampling, and energy-modeling modules. The route pipeline outputs interactive maps and time-series plots for fuel, speed, and power analysis.